Want to know a quick and easy way to beef up your content to make it seem more authoritative? Throw in some stats.
People love reading stats. Why? Because it’s hard to argue with numbers, and they help you give proof to back up whatever you’re talking about. For instance, let’s say you wanted to write about how inbound marketing is the best thing ever. Which of these sentences do you think is going to be more persuasive, convincing and effective?
- “Inbound marketing has shown to be a more effective way to reach customers”
- “Inbound marketing delivers 54% more leads into the marketing funnel than traditional outbound marketing”
The use of statistics in the second sentence makes a much bigger impact. Because let’s be honest, anyone can make general statements like the first example. But when you’re showing your audience real proof, then they’re much more likely to trust what you’re saying.
Here’s some ways to make blog posts that use stats and numbers to beef up your content.
[Tweet “Spice up your content by adding stats and numbers!”]
1. Case Studies
Case studies are usually filled with stats. For instance, in my Twitter Follow Back case study, I gave you the real numbers of how much my Twitter following grew. I could’ve easily just said that “I got more followers”. But what most people really cared about was how many more followers I got.
Or if you look at my post about how I grew my organic search traffic by 350%, the most powerful part of that whole post is the numbers. If I would’ve just called the post “How I Grew My Organic Traffic In 30 Days” it wouldn’t have anywhere near the same impact as it does now.
In order to do this on your own site, you have to go into the case study with a plan. Measure everything from the very beginning like I did with my Twitter case study. That way you’ll be able to provide stats throughout the entire process. For this to work, the topic/focus of your case study has to be something that can be measured.
2. Stat Roundups
Roundup posts in general are pretty awesome. They tend to get shared on social media a lot and get linked to naturally. A roundup post is just a collection of thoughts, tips, or examples from different people. For instance, some people like to do roundup posts where they ask a bunch of different industry experts a question, then combine all their answers into one post.
Here’s an example of a roundup post on PointBlankSEO.com. They asked over 28 SEO pros to tell their biggest link building fails. These posts are very effective but they can take a long time to put together because you have to wait to get responses from other people that are usually pretty busy.
But here’s an easier way to do roundup posts. Use information that’s already out there and curate it all in one post. That’s what I did with my SlideShare presentation on blogging tips. I sourced some tips that top bloggers gave in their own posts and included them in the presentation.
You can take this technique to the next level by doing a stats roundup post. You’ve probably seen these posts before. For example, this post “25 Stats Content Marketers Need To Know“. They just gathered a bunch of stats from different places and organized them into one post. They didn’t have to go out and survey a bunch of people. They used content that already existed on the web and curated it, which saves you a lot of time, money and effort.
Here’s some tips for doing statistic roundup posts:
- Use multiple sources for your stats.
- Organize the stats into subcategories like this if you can
- Include A LOT of stats (20+)
- Make stats tweetable like in this post
- Don’t forget to give credit to the source of your stats
- Consider repurposing your post as an infographic
3. Infographics
Infographics are perfect for stats. And they give you two distinct advantages:
- You’re using a different type of content, and your brain processes visuals 60,000 times faster than it processes text!
- You’re going to be able to jam pack your infographic with stats
I’ve touched on two of the best resources to make infographics online in this post (Canva and Piktochart). Both of them are great for non designers.
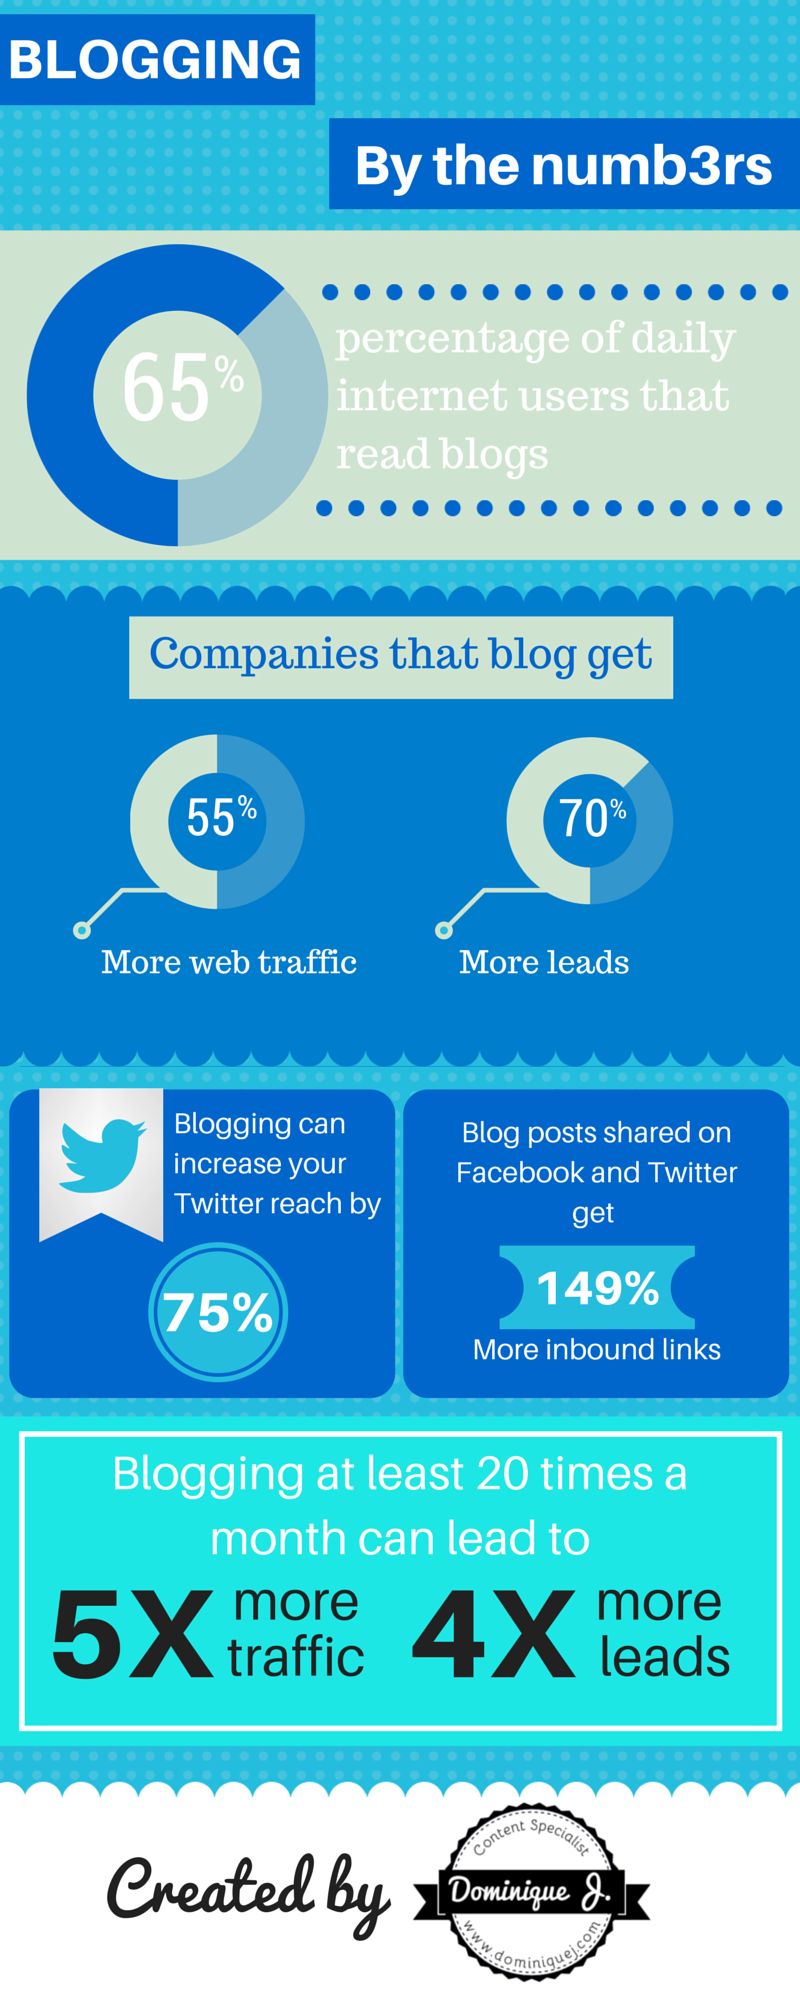
Your infographic doesn’t have to be anything super fancy. For instance, here’s one I made about blogging. It’s a good visual way to give your audience valuable content without making them read through paragraphs. They get the juiciest information right away.
 Where To Get Statistics?
One of the most time consuming parts of including numbers and stats in your content is finding the data. But with a little searching, you’ll be able to find them in no time.
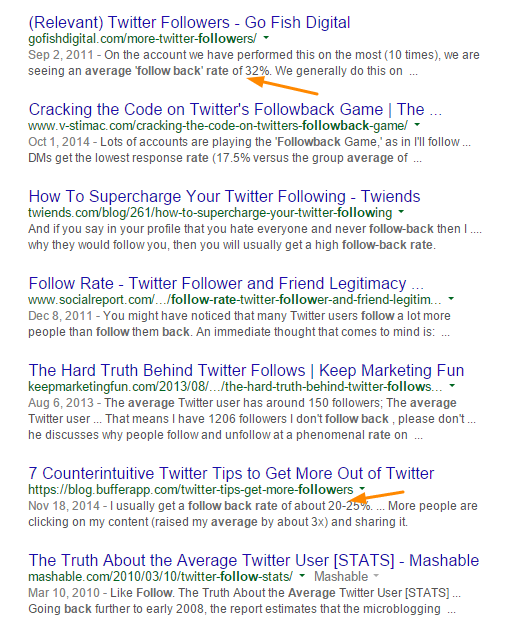
My top technique for finding stats is just Googling different things. For instance, if I want to know a stat about social media marketing, I’d just Google “social media marketing statistics”. Or let’s say you want to get a bit more specific and find a stat for the average followback rate on Twitter. Just Google “average follow back rate” and you’ll see plenty of posts that you can get the info from.
Some other good sources of statistics that you can use in your blog posts, infographics and other content are:
What are you waiting for? Spice up your content by adding in stats. It does add a little more time to your writing process since you have to do some more research, but your goal is to create the best content possible. Taking a few extra minutes to find some good stats to add more credibility and value to your content can go a long way.


Great post, Dominique! Spot on that people love the numbers! Cool infographic too, very impressive! Do you mind sharing what tool you used to create that?
Thanks David! I used Canva, it’s my favorite graphics tool.