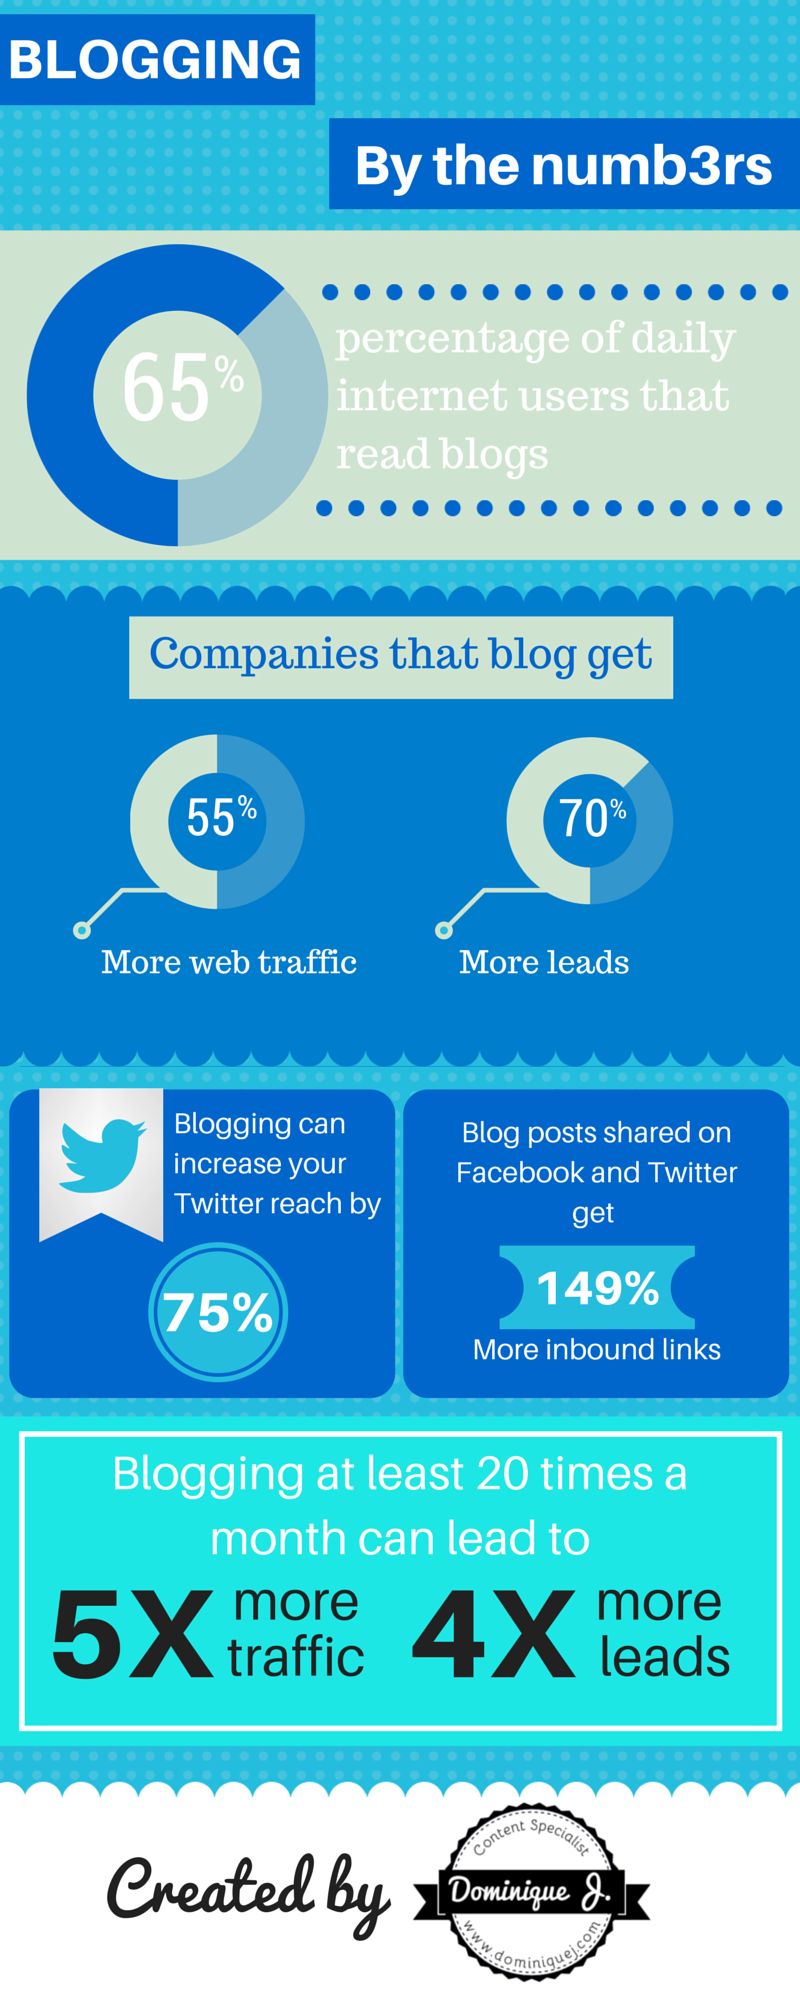
One of my favorite graphic design tools, Canva, recently added infographics to the list of things you can make. So naturally, I wanted to try it out. I’ve said it over and over again, that I’m as far from a graphic designer as you can get. But since graphics are super effective for displaying content, I try to implement them however I can. I suggest you do the same too!
I used some stats I got from this blog post from Unfunnel, and whipped something up with Canva (from scratch). If you’ve been on the fence about whether or not blogging is effective or worth your time, maybe this infographic will help give you the push you need. Or maybe you’ve been trying to convince execs at your company that blogging is worth investing in. This infographic can help with that too. Check it out, tweet it, post it on your site, show your dog (ok, maybe that’s a bit much), and enjoy!
And if you suck at graphic design like me, I highly suggest giving Canva a try to make an infographic. They even have some templates to help you get started so you don’t have to start from scratch like I did.
Like the infographic? Just copy and paste the code below to embed it on your site!
![Blogging By The Numbers [Infographic] Blogging By The Numbers [Infographic]](https://dominiquej.com/wp-content/uploads/2015/05/blogging-statistics.png)


I am always looking for ways to do an infographic. Thus far, I’ve been using WORD and Powerpoint. I think I’ll be giving Canva a try.
Thanks for the tip!
Laura Beth
Awesome Laura. Canva is very useful and makes it a lot easier to make infographics than Word or Powerpoint. Thanks for checking out my post!