How often do you check your Google Analytics? If you’re like most bloggers, it probably isn’t often enough.
As a blogger, you’re in charge of every aspect of your site. Creating the content, promoting it, connecting with influencers, and keeping tabs on your stats. The problem that bloggers run into is being overwhelmed by all the info that Google Analytics gives you.
So what ends up happening is you setup analytics on your site because every guide to setting up a blog tells you to. You might even log in a few times each month to see what’s going on. You toy around a little bit and look at how many visitors you’re getting and try to figure out what all the different reports on that left sidebar are for, but after while you’re even more confused than when you started. So you exit and just forget all about it.
You go to look up tutorials on how to use Google Analytics and you’re greeted by a bunch of videos and guides that are written for marketers, not the average everyday blogger. The guides start talking about goal tracking, conversions, setting up multi-channel funnels, and a bunch of technical stuff that gives you a headache. And that’s not your fault.
Data Isn’t Sexy
I get it, data is boring. We all want to spend our time focusing on the creative stuff like coming up with content, putting together giveways, and the exciting parts of blogging. But you won’t have any real idea of how your blog is doing unless you’re keeping track of everything. It would be like playing basketball without keeping score or tracking stats. If you don’t now what your average 3 pointer percentage is, how will you know that it’s something you should work on?
Look at Google Analytics as the score keeper and stat tracker for your blog. Virtually anything you want to know about how your blog is doing can be found in Google Analytics. Coincidentally, all of that data is also what tends to make bloggers avoid Google Analytics like the black plague.
Here’s the bright side. Most bloggers (especially when you’re just starting out) don’t really need to look at a majority of the reports in Google Analytics. I know some people might disagree with me, but from my experience most people use Google Analytics for a small portion of what it’s really capable of. I’ve seen interviews with some of the top bloggers out that say they never check their analytics at all!
The goal is to find a happy medium between not checking your analytics at all and not trying to master every single feature of Google Analytics to the point you overwhelm yourself.
I’m here to help you overcome the confusion and intimidation of Google Analytics. We’re going to cut through the sections that you don’t need to be worried about right now and simplify it specifically for bloggers.
The screenshots in this post are of another site I run, not this one FYI. It hasn’t been updated in a long time, but I might use it as a case study later on so it’ll help you all get familiar with it.
Google Analytics Dashboard Overview
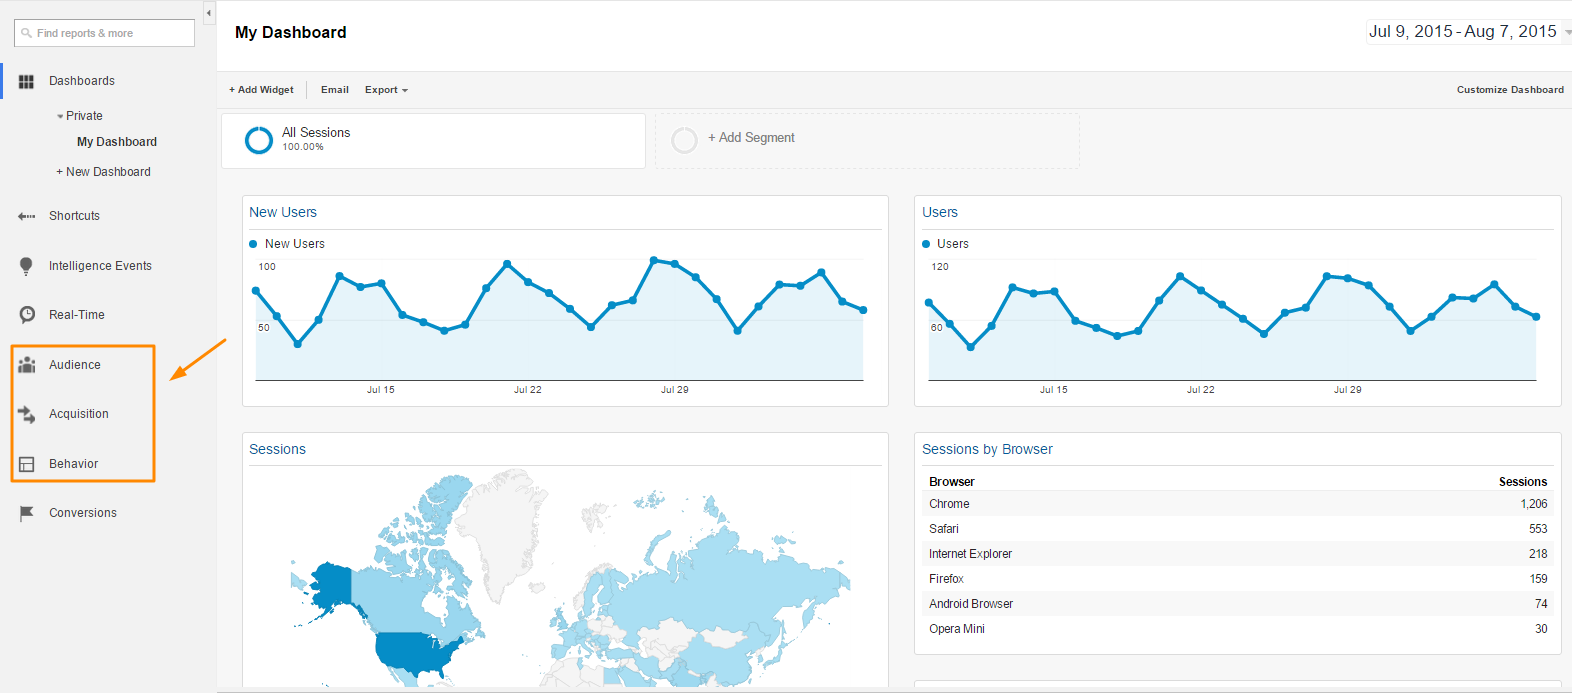
Right off the bat, let’s take away the parts that you don’t have to worry about. For the most part, I only look at 3 sections of Google Analytics on a regular basis. They answer 3 of the most important questions any blogger will have. Who, how, and what.
- Audience: Who’s coming to your blog?
- Acquisition: How are people finding your blog?
- Behavior: What are people doing on your blog?
Block everything else in the dashboard out of your mind. I’m not saying that the other sections are useless, because they are very useful. But they’re not going to be crucial to the success of your blog right now. These three sections are going to tell you a majority of what you need to know about how your blog is doing.
Audience
Who’s coming to your blog?
The audience section is where you’re going to see information about who your readers are. You can see geographical information, what type of device they’re using (mobile or desktop), what browser, how long they’re staying on your site and a lot of other cool data. Here’s the most important parts of the audience section to take a look at.
Geo
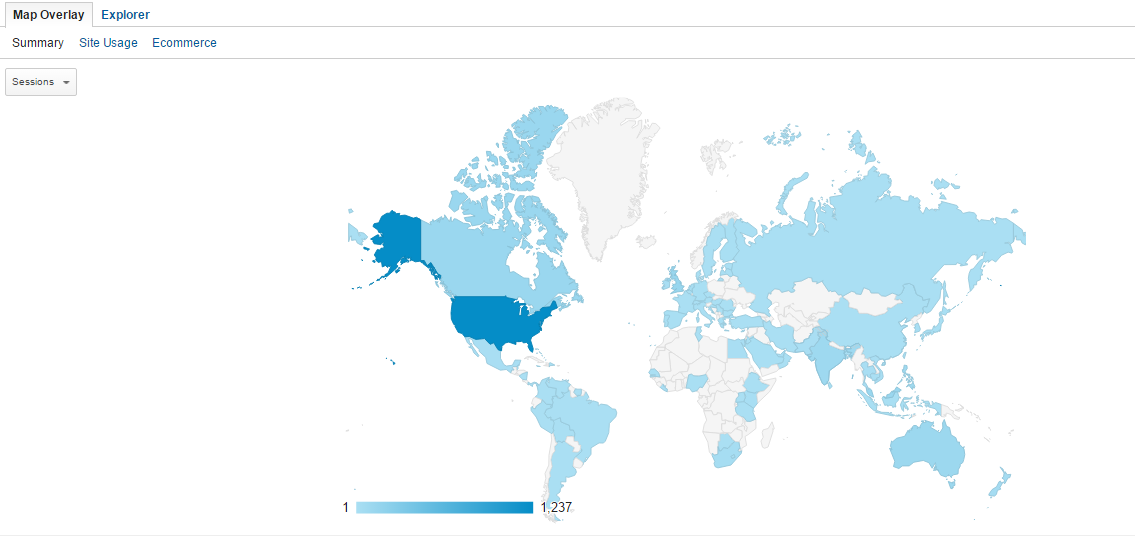
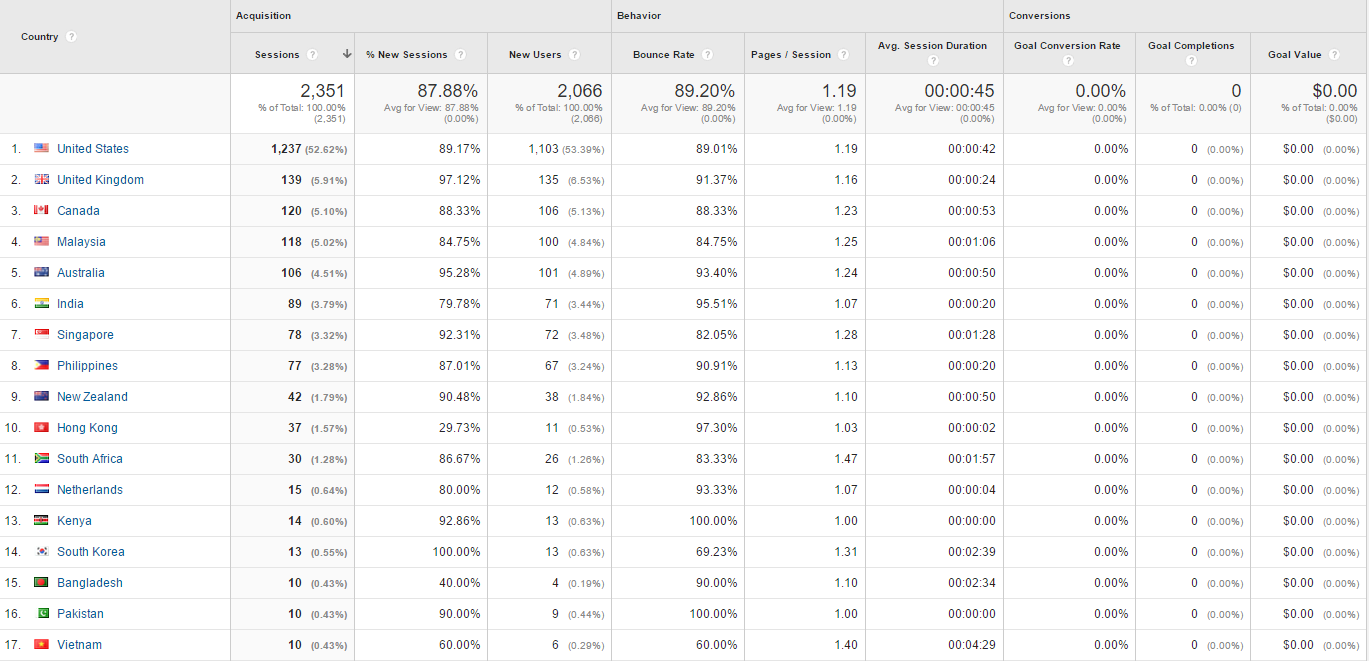
This is how you’ll see where your readers are across the globe. There’s two parts on this report, a map and a list of the countries. The map gives you a good visual. The darker the area of the map, the more traffic is coming from that area.
Then you have the list of the locations which gives you some helpful data to go along with it across the top bar (Sessions, Bounce rate %, average time duration, etc.) If you’re ever confused about what a certain metric is, just hover your mouse over the little question mark and Google gives you a good description.
Google goes deeper than just the country too. If you click on any of the countries, you’ll see a breakdown of sections, states, or even cities. If you have a blog that’s geographically based like Girl Meets Food for instance, it’s a good idea to see where your traffic is coming from on a city level.
Behavior
The behavior section gives you info on the patterns of your traffic. The two most important questions you’ll get answered here are:
- How many people are returning to my blog?
- How long are people staying on my blog?
The answer to the first question is under Behavior>New vs. Returning
It’s pretty self explanatory. The report shows you how much of your traffic is coming from new users who have never been to your site, and how much comes from people that have been there before and have returned. Don’t be worried if your number of new users is a lot bigger than your returning users, that’s normal. What you can do is use that number as a baseline to improve on. If you have 100 return visitors this month, maybe try to get that number up to 150 or 200 next month.
Something I like to do on this report is compare the metrics from my returning visitors to my new ones. I’ll look at the bounce rate, pages per session and how long they stay on the site.
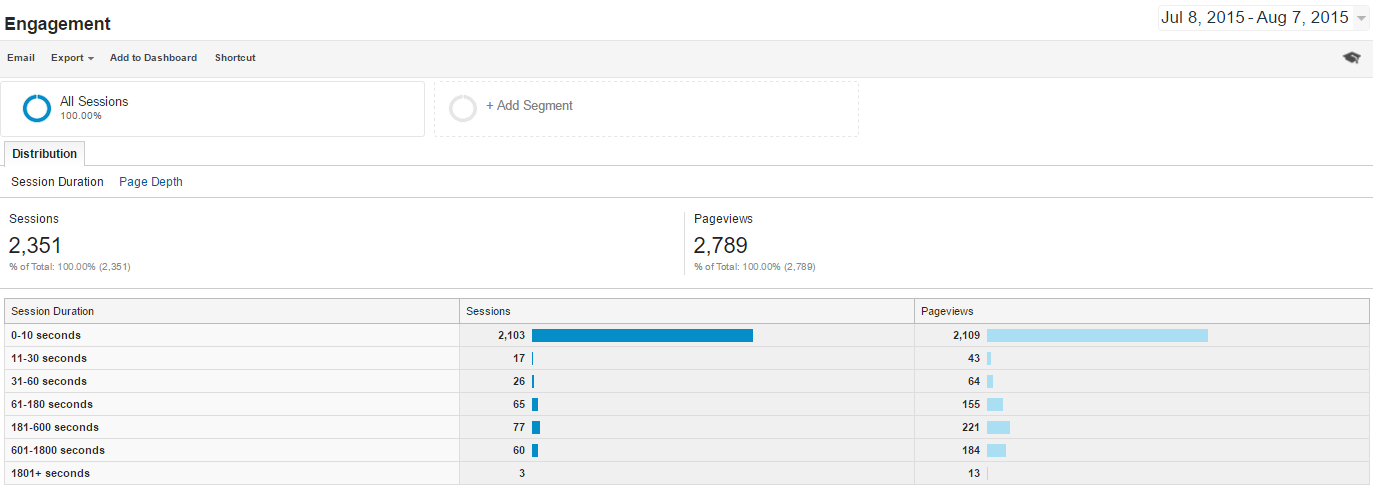
To find out how long people are staying on your blog, you’ll want to look in Behavior>Engagement.
In this report, you’ll see how long people are staying on your site before they exit. The less time people are spending on your site, the less they’re engaging.
If you’ve never looked at this report for your site before, you’re probably going to have a brief second of WTF?? when you see that most people are only on your blog for less than 30 seconds. As disheartening as it seems, don’t freak out. Most people leave a website within 59 seconds.
You should start to be concerned when over 90% of your traffic is on your site for less than 1 minute though. The blog I’m using as an example in this post falls under that category. Only about 8% of the sessions are more than 60 seconds long, so it’s something I’ll work on.
Mobile
Remember when Google started making a big fuss about making sure your website is mobile friendly? Well this report in Google Analytics shows you why.
You’ll see a breakdown of how much of your traffic comes from the three major types of devices:
- Desktop: A desktop computer or a laptop (ex. Macbook or iMac)
- Mobile: A mobile phone/smart phone (ex. iPhone or iPod touch)
- Tablet: Well, a tablet… (ex. iPad)
Notice how almost half the traffic comes from people on a mobile phone or tablet. Your blog needs to be fully functional no matter what kind of device your readers are using. Not only will it help people stay on your site longer since it’s easier to navigate, but it’ll also stop you from becoming one of the sites that loses rankings for not being mobile friendly.
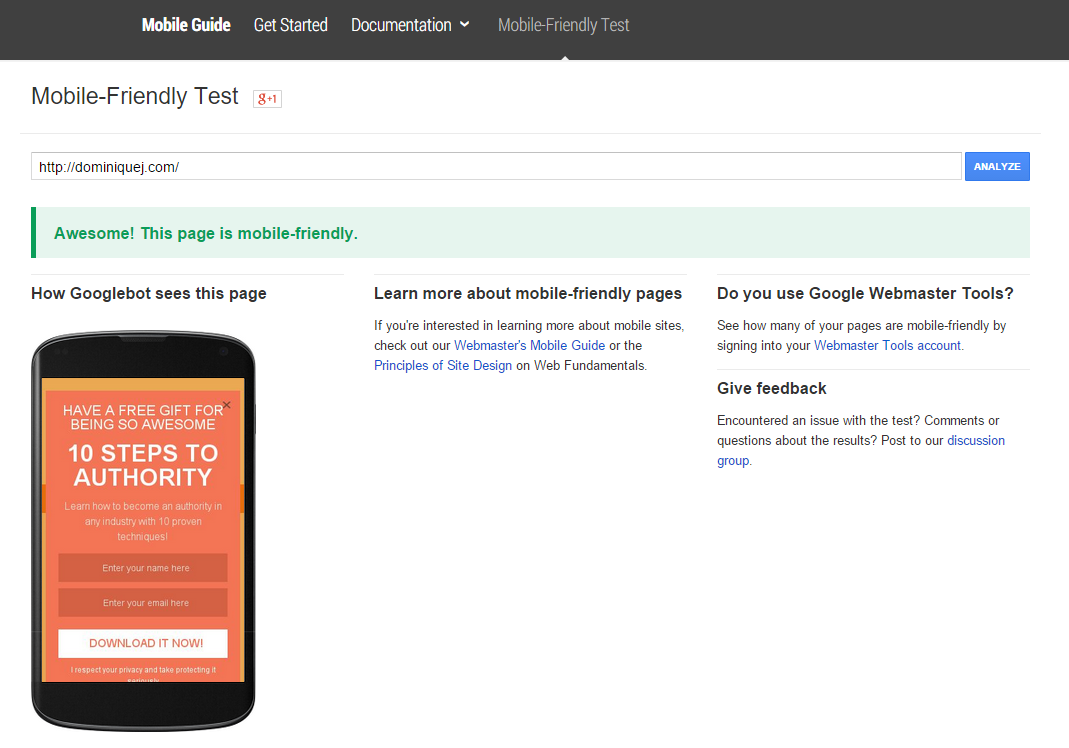
Do a quick check for you blog using Google’s mobile friendly test tool. The easiest way to make sure your site is mobile friendly is to use a responsive WordPress theme.
Acquisition
How are people finding your blog?
This is my favorite section of Google Analytics because as bloggers, we all want more traffic. And the Acquisition reports tell you where your current traffic is coming from. Whether it’s people finding you through Google searches, clicking on a link from another site, or just putting in your site’s URL directly into their web browser. You’ll be able to see all of that info here.
The report shows you what your biggest traffic sources are, what other sites are pushing traffic to you and a lot of other cool data that’ll help you find new sources of traffic.
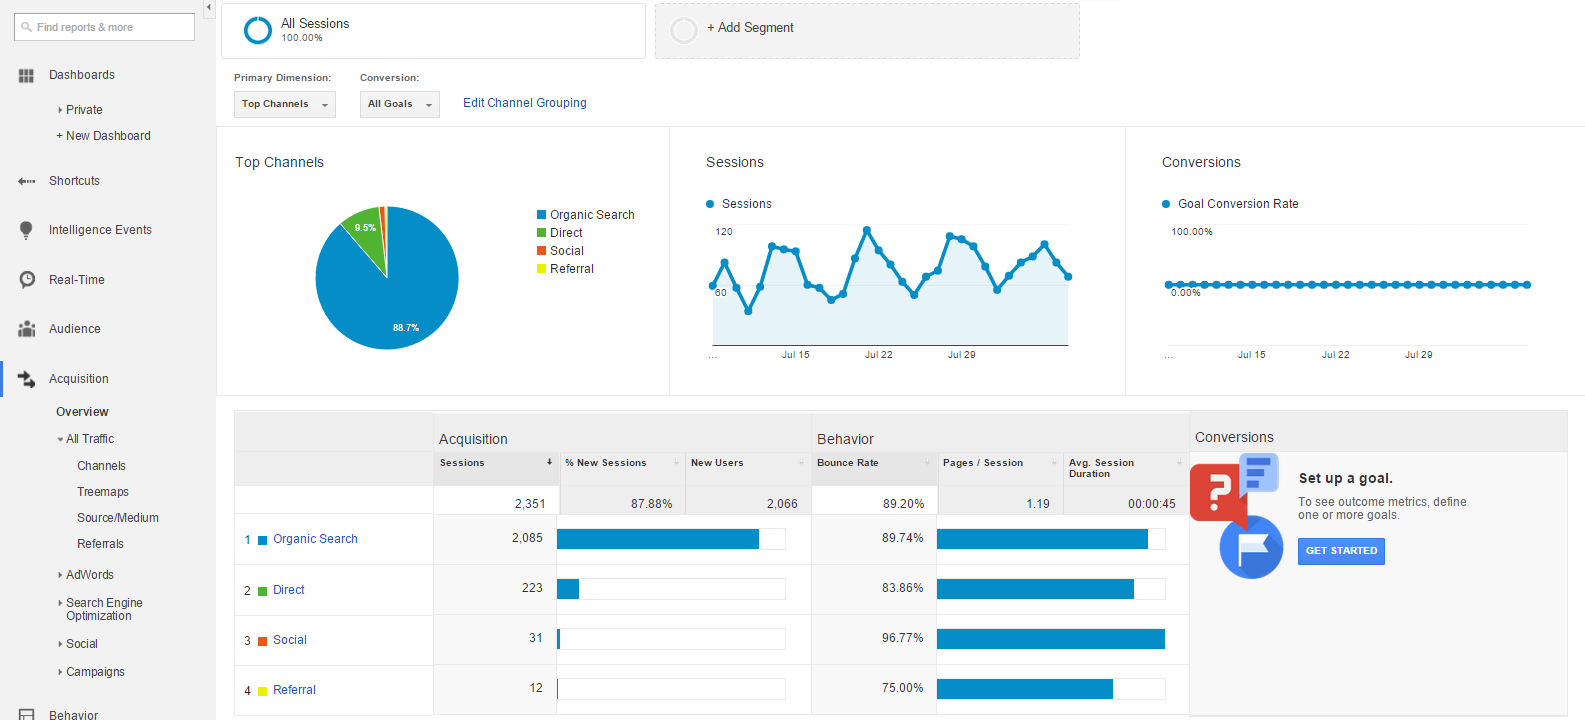
I like to start out in the Acquisition>Overview screen. This’ll give you an aerial view of where your traffic is coming from.
You see a pie chart at the top, then a list of the traffic channels below. A traffic channel is just the type of traffic it is. In this report, there’s only 4 channels, but you might have more. The most common channels are:
- Organic Search: People that find your site through a search engine like Google
- Direct: People that come to your site directly, usually by typing in your URL in their browser. But it can get a little more complicated.
- Social: People that come to your site through social media sites like Twitter, Facebook, etc.
- Referral: People that come to your site from a link on another site/blog
- Paid: People that come to your site through clicking a Google AdWords ad
- Email: People that come to your site through your email marketing campaigns
Let’s do a deeper dive into this section. The overview screen gives you a good 1,000 foot view, but to start narrowing down and seeing the real value, go to Acquisition>All Traffic>Channels
Here’s where you can compare the different metrics of each channel. You can see how many sessions are coming from each channel, the bounce rate, how long people stay from each channel and all that good stuff.
Ideally you want to have a healthy mix of traffic sources. But keep in mind that there’s a good chance that a majority of your traffic will come from organic search, especially if your site is content heavy. This can vary from site to site though.
On the report, you can click on each traffic channel to get more information. Let’s take a look at organic, social, and referral, since those are the most common channels for most bloggers.
Organic
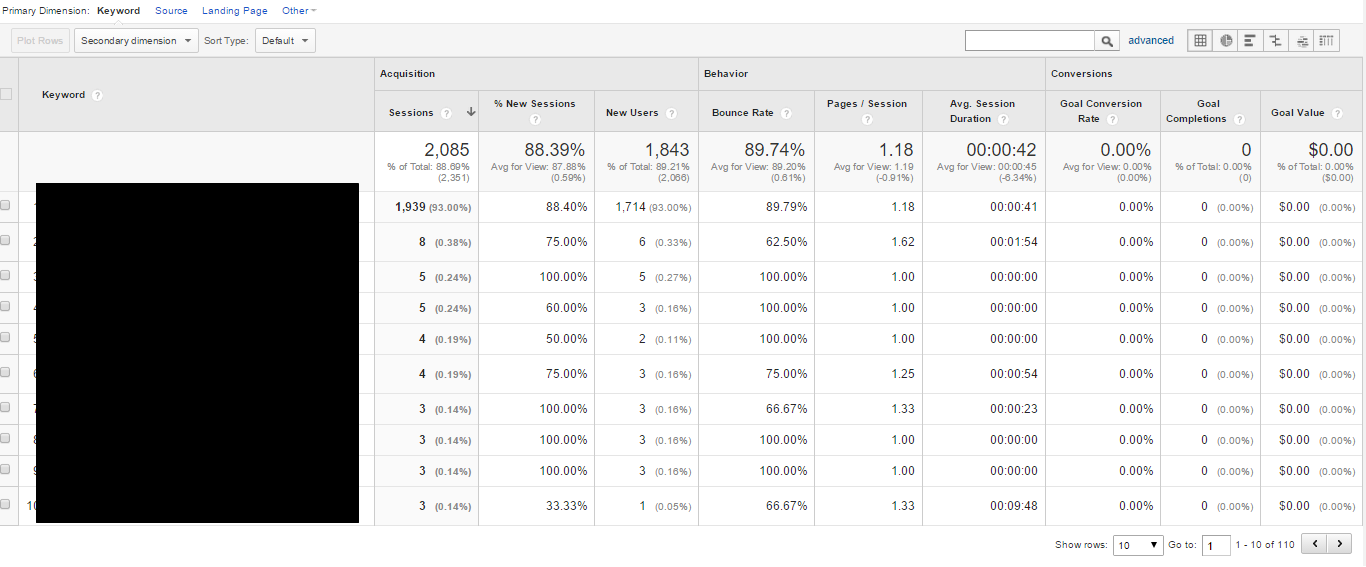
When you click on Organic, it’ll take you to a screen that shows some of the different search terms people are using to get to your site. In order to unlock this data, you have to connect your Google Analytics account to Webmaster Tools. Here’s a tutorial.
I like this report because it gives you a basic idea of what type of content people in your niche/industry want to see. For instance if you have a health blog and notice a lot of traffic coming from people searching for vegan recipe related keywords, that’ll give you some ideas for new content.
Unfortunately you can’t see all the phrases people are searching to land on your site. Most of the traffic will show as (not provided). Here’s some more info on what that means. But it’s a nice play to start.
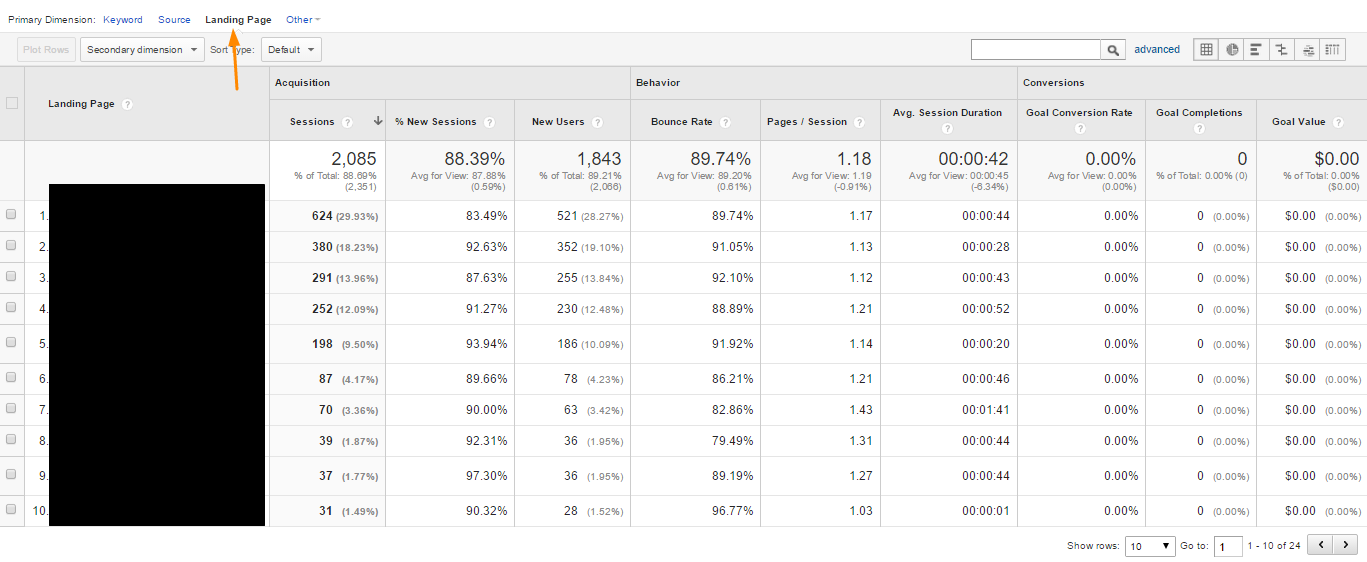
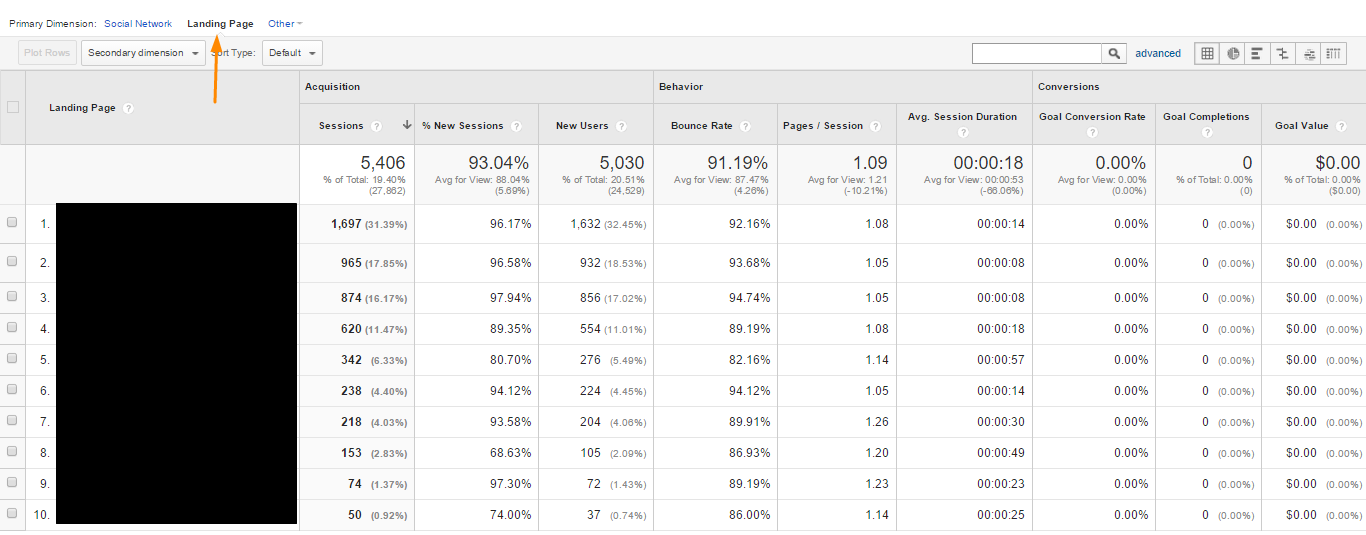
Another cool thing you can do on this report (and all of the traffic channel reports) is see what specific pages your organic traffic is landing on the most. Just click on the Landing Page tab where it says “Primary Dimension” in the report. These are the pages that people are landing on from their Google search. And you can see the different metrics for those pages specifically from organic search.
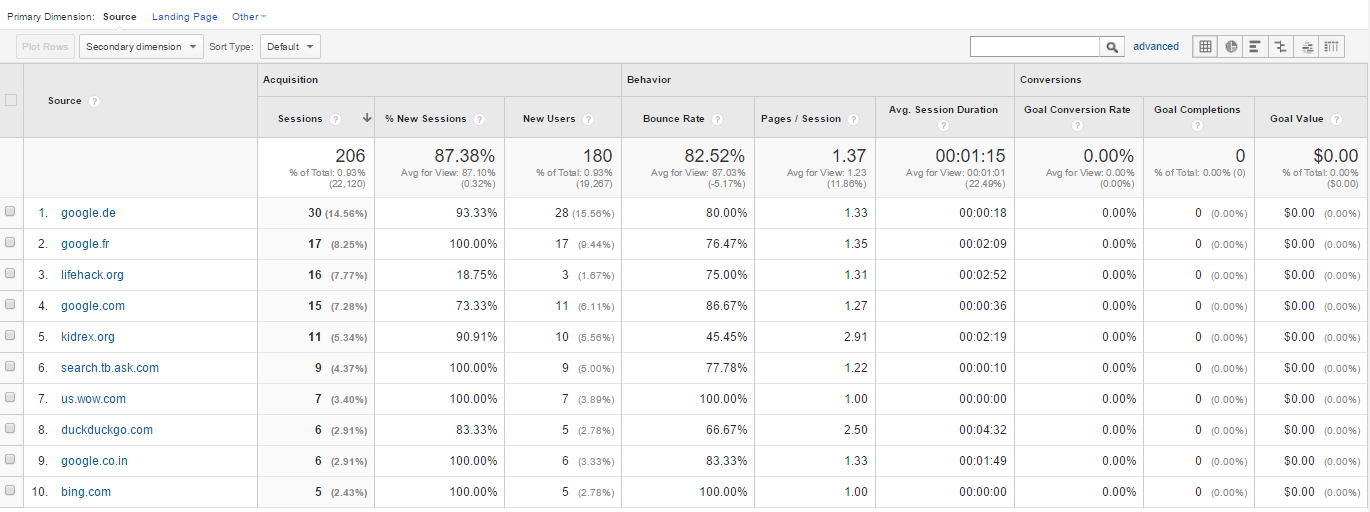
You can change the “Primary Dimension” to source to see which search engine brings in the most traffic. Spoiler alert, it’s probably going to be Google.
Social
The site I’m using as my example doesn’t get much traffic from social media anymore. So instead of looking at the past 30 days, I changed it to a historical view of the past year.
When you click on Social from the Channels screen, you’ll see an overview of all the different social media sites your blog gets traffic from.
The little symbol you see next to Google+ and Pocket means that they’re Google Social Data Hub Partners. It basically means they share their data with Google. Here’s more info on that in case you’re interested. The most popular sites that are a part of the social data hub are:
- Disqus
- Delicious
- Google+
- Meetup
When you click on a social channel from the report, it’ll give you more insight into the metrics of that particular social media channel.
This report is cool because it shows you which social network gives you the highest quality traffic. For instance, from the screenshot above it looks like Google+ traffic is the best for this blog. The bounce rate is the lowest, people stay on the site the longest, and they visit more pages per session. And even though StumbleUpon sent the most traffic, the people don’t tend to stay for very long.
Just like with the organic traffic report, you can also select landing pages as your Primary Dimension to see which pages get the most traffic from social media.
It’s interesting to compare the top pages from organic search to social. You can start to see trends in what type of content performs best with organic vs. social.
For example, for this site the most popular landing pages from social media are list posts “10 ways to___”. But for organic, the top landing pages are more informational posts “How to ___”. You can use that data to figure out what type of content to create in the future. Since this site doesn’t get much social media traffic anymore, when I decide to get active with it again I’d probably make a lot more list posts.
These are the types of things that Google Analytics can really help you do to improve your blog. Without having this data available, it would be a lot harder for me to gauge what content performs the best and what direction to take my blogs in.
Referral
The referral report is going to show you what other sites are bringing traffic to your blog. As you start to get backlinks from other sites, hopefully people will be clicking on those links to land on your site. This is where you’ll be able to see which referring sites give you the best traffic.
It’ll list the name of the site that referred the traffic to you. And if you click on any of those, it’ll take you to the exact page that’s referring traffic to you. You can click on the little pop out arrow box to open up the page that’s linking to you.
A creative way to use this report is to reach out to sites that are linking to you and sending you referral traffic. Let them know that you were looking through your blog’s analytics and noticed their blog post was referring a lot of traffic to your site and thank them. It’s an easy way to “break the ice” and start building relationships with other bloggers. That’s a much better way of introducing yourself than spamming people.
Behavior
What are people doing on your blog?
At this point, you know who’s visiting your blog and how they got there. The last piece of the puzzle is seeing what they’re doing once they’re on your blog. You got some of this info from other reports, but these reports will fill in the gaps and give you even more insight.
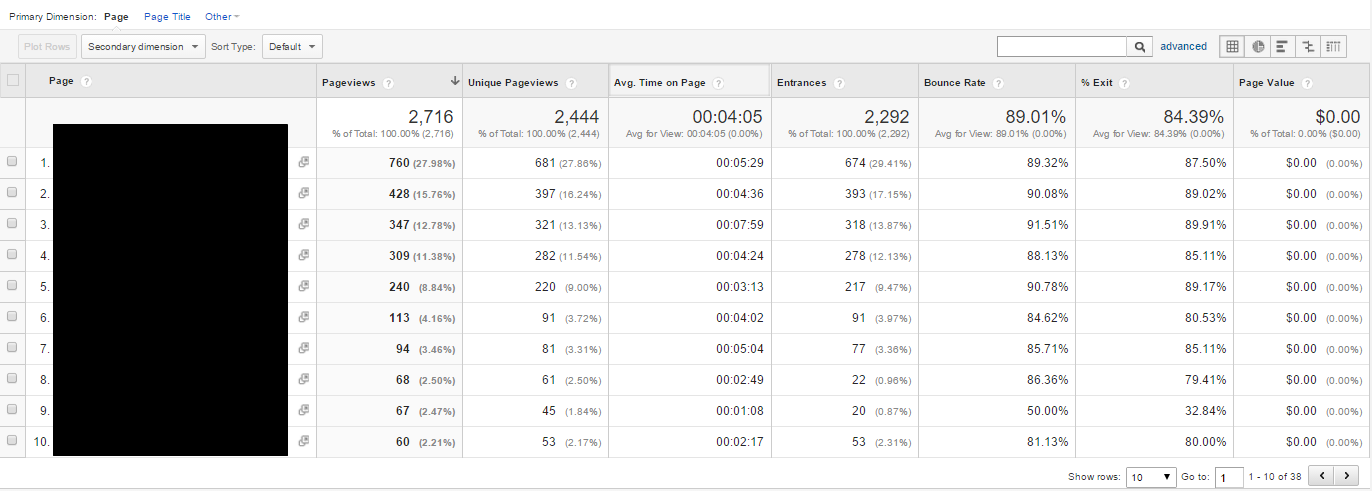
I like to start with Site Content>All Pages
This report is going to show you the highest viewed pages on your entire site. There’s so much value you can get from this, so make sure you check it on a regular basis. My top 3 metrics I look at are:
- Unique Pageviews: Shows you how many different people viewed the page
- Average Time On Page: How long do people spend on the page
- Bounce Rate: How often people are leaving your blog after being on that page
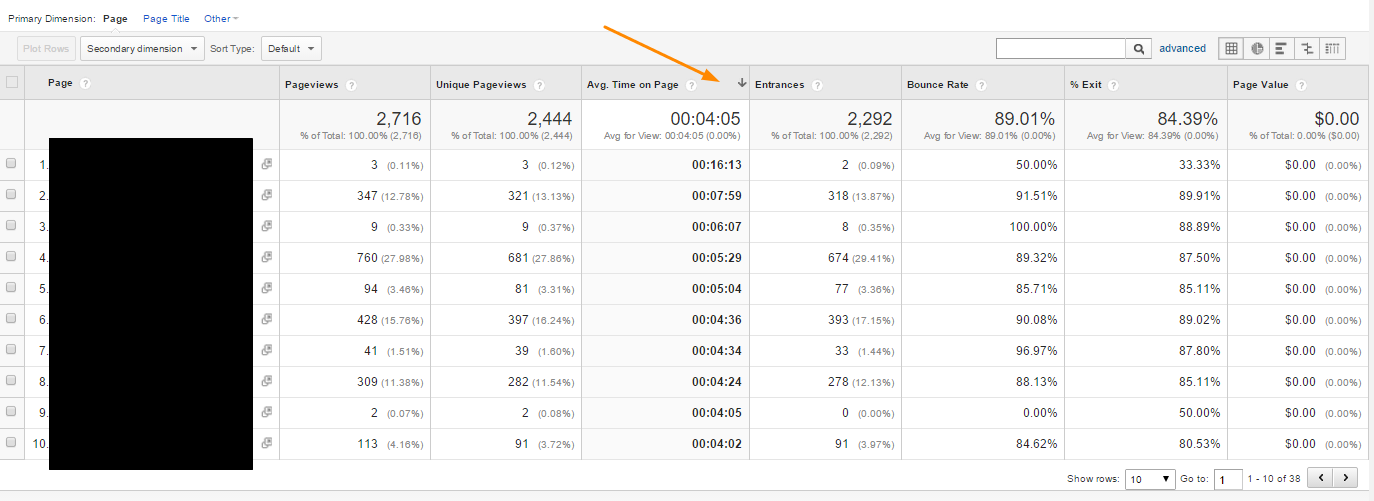
You can click on any of the columns to sort the data and find the top pages for that category. For instance, let’s say you wanted to see what page on your blog people are staying on the longest. Just click on the Average Time On page column and it’ll sort all of your pages to show you which content is keeping people on your site the longest.
Or if you wanted to see which pages have the highest bounce rate, you could click on that column. Then you can take a look at the pages and see if there’s anything you can do to stop people from leaving your blog after landing on that page. You might need to add some more internal links on the page, improve the load time, or make other changes.
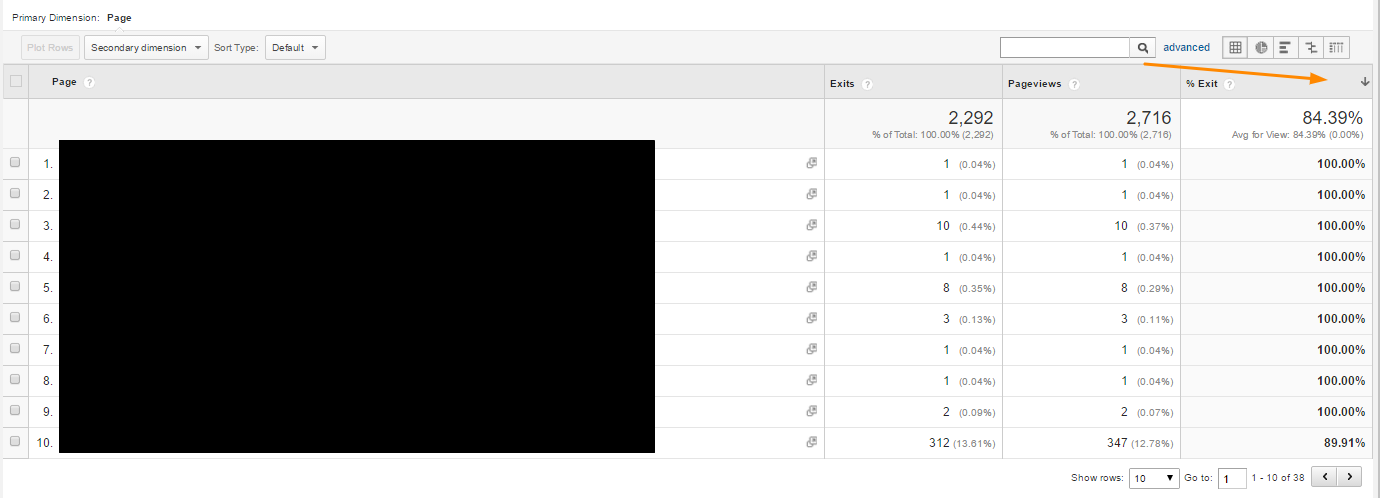
Another report under Behavior that’ll show you what pages people tend to leave your site on is the Exit Pages report. An exit page is the last page on your blog someone visits before they leave.
By default this report is set to show the pages with the highest number of exits. But it’s more helpful to look at the pages that have an overall high Exit %. So click on the exit % column to sort by highest to lowest.
The last section under behavior that I’m going to talk about is Site Speed. Site speed is something that a lot of bloggers overlook because it can get pretty technical. But it’s not something you should just ignore.
Under Site Speed>Page Timings, you can see how the load time of individual pages stacks up against the overall speed of your site.
If certain pages are loading a lot slower than the other ones, go in and give it a look. Does the page have a lot of images that aren’t optimized? Does it have a lot of embedded media like videos and tweets? These are things that can be pretty easy to fix. But sometimes the problems can be a little trickier.
For those pages, you can go into Site Speed>Speed Suggestions. You’ll see a list of all the pages on your site, and different metrics like their average load time and a page speed score.
Find those pages from the page timings report that were loading slower than the others. Under the Page Speed Suggestions column, you’ll see that Google will give you suggestions to improve the load time. Try to fix those specific issues to improve the page speed. If some of the suggestions seem more advanced than what you’re comfortable with, look for a tutorial online or see if you can get a developer to help you out.
Stop Being Afraid Of Google Analytics
Google Analytics doesn’t have to be a huge scary task. Once you start learning the basics and focus on the reports that are the most important for bloggers, you’ll start to realize how powerful it really is.
My one suggestion would be to start checking it on a regular basis. This is one of the top reasons people get confused with Google Analytics. They’ll only check it once or twice a month. I check my analytics daily, but you don’t have to check it that frequently. A few times a week is good to start out with. Because what tends to happen is that if you check it only once a month or once every few months, everything looks completely foreign to you every time you log in.
When you’re looking at it on the regular, you’ll start to get more familiar with the layout, where things are, and what all the different numbers mean. You’ll also be able to see how your site is growing and changing over time, which is the main point of having analytics in the first place.
If you’re not tracking your blog with Google Analytics, you’re basically blogging blindly. Just adding content to your site without measuring anything puts you at a huge disadvantage. Start getting more familiar with Google Analytics and use it take your blog to the next level.









Dominique ==
I know you moderate your user comments, so I’m posting this for you only. I suggest you read it but NOT publish it for public consumption.
I just read your articles on installing GA and on how to use it efficiently/effectively. I’ve avoided GA because back when I had really slow internet access I would visit sites and watch (and watch and watch!) as all their GA data was transferred for each page load. It used to aggravate me – so much time wasted.
After reading your informative posts I was almost convinced to install GA, but a quick Google search turned up the article below, which confirms my concerns. I submit it for your benefit and edification only.
Tom
“Why I removed Google Analytics from my website”
http://tristandenyer.com/why-i-removed-google-analytics-from-my-website/
Uh, oh! Looks like you DIDN’T moderate the comment above. Perhaps delete it…